
Got KPIs or OKRs to meet? Wonder where you’ll get the data to validate them? Check your PPM.
Project Portfolio Management (PPM) software stores a large amount of information. You know that, but, like many portfolio managers, you may not be aware of how your treasure trove of PPM data can be used to make important organizational decisions.
You know that PPM data is essential in tracking projects. And that’s great. But Project Portfolio Reporting can answer some of the bigger questions your organization has such as:
- Are we going to meet our strategic goals? Why not?
- What is the ROI on our portfolio?
- Should we invest more money into capital projects?
- Which department requested the most projects?
Answers to these questions and others are the lifeblood of your organization. Let’s examine the key elements needed to support your organization via a robust reporting process.
The following key project reporting features can support decision making across your organization.
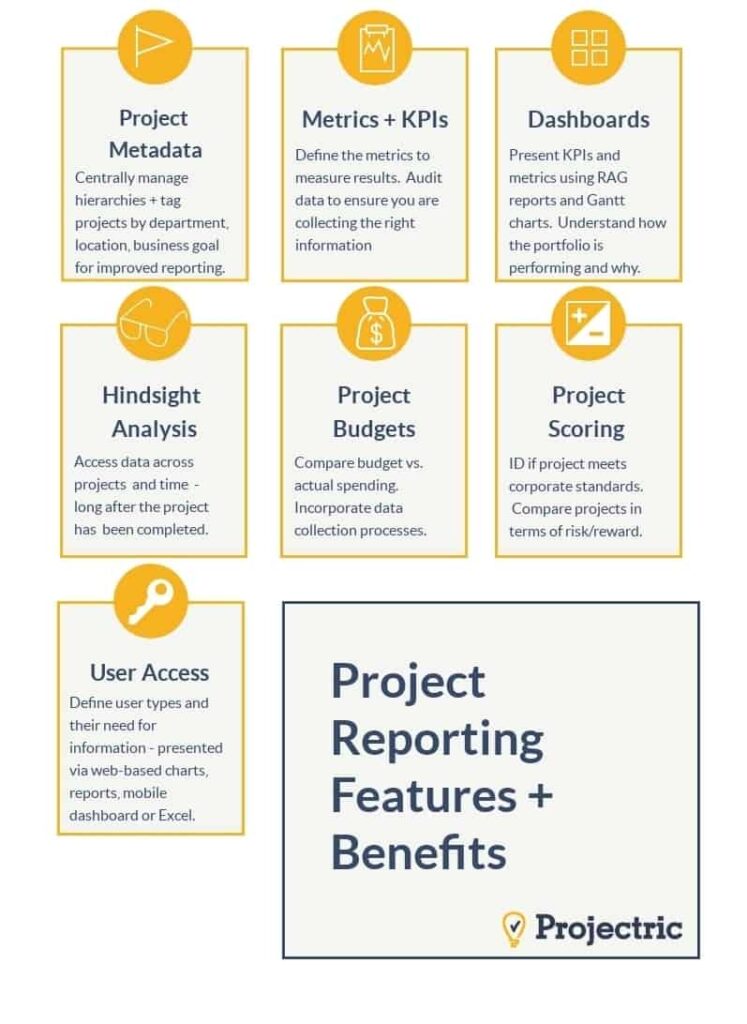
We will go through each of these to illustration the power of PPM data.
Metadata
Project Portfolio Management captures and stores data in several ways throughout the project lifecycle:
- Quantitative and qualitative data via project intake forms (start date, PM name, business goal)
- Data imported from other systems (PM, accounting, HR)
- Calculated or derived data (scoring, variances, percent complete)
Organization-specific metadata
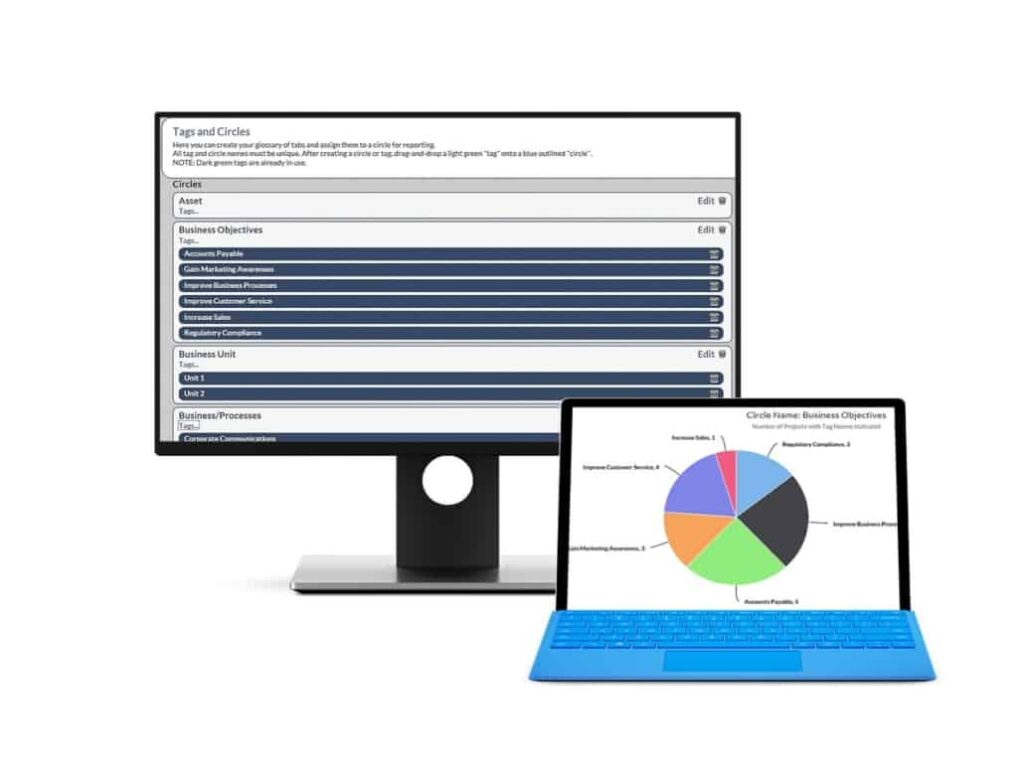
Metadata improves reporting by making information more accessible to non-project management roles – especially those outside the IT department. The first step in using metadata for reporting is to create centrally managed hierarchies and apply the proper tag to projects. Some places to find relevant metadata include:
- Departments (IT, sales, finance)
- Locations (HQ, factory A, office B)
- Business Goals (increase revenue, reduce expenses, customer satisfaction)
You can use this critical metadata to align reporting with your organization’s goals. Doing so will enable your stakeholders to get on-demand insight into initiatives supporting Governance, Transparency and corporate strategy.
Metrics and KPIs
A comprehensive reporting platform that records data for the key metrics established for project or portfolios is critical to deriving value from PPM data.
Once metrics are defined and reporting is established, auditing data ensures the collection of information at the proper level of granularity and frequency.
Reporting can track progress toward KPIs, (Key Performance Indicators) or OKRs, (Objectives and Key Results) thus providing users with an up-to-date understanding of how the portfolio is performing.

Dashboards
PPM dashboards indicate HOW the portfolio is performing, and with more-comprehensive reports and analysis, can help you understand WHY. Brevity and focus are preferred over detail and complexity.
Dashboards effectively present KPIs and metrics to a wide audience. Using web-based dashboards enables the organization to support the on-demand requirements of large and diverse sets of stakeholders.
Your PPM reporting solution must allow you to create meaningful dashboards by grouping metrics based on the information they describe (resource utilization) or their relevance to a role (CIO dashboard).
Project Portfolio Management Reporting software can enable the customization of dashboards to the individual user.
Common elements of PPM dashboards include:
- KPIs (Key Performance Indicators)
- RAG reports (Red Amber Green reports)
- Gantt charts
Hindsight Analysis
Hindsight Analysis provides the ability to analyze data across many projects and time periods. Project Portfolio Management software gathers data from the moment the project is requested for consideration until long after it has been completed or deployed. This perspective enables organizations to track their overall effectiveness and help surface ideas for improvement.
Hindsight Analysis illuminates:
- Whether the project fell short, met or exceeded expectations
- Whether similar projects should be funded in the future
Accuracy of the risk/reward measurement via established scoring processes
Project Budgets
Analyzing budget vs. actual spending provides timely insight that can be applied to concurrent projects.
Anticipated expenses are collected in the early stages of the project lifecycle and compared to actuals as data becomes available. Project Portfolio Management Reporting software incorporates these data collection processes into the project workflow, producing key insights into budgetary performance.
Project Scoring Reporting
Project Scoring can help you determine whether projects are meeting corporate standards for approval.(Read more about Project Scoring methodology in this blog post.)
PPM Project Scoring reports enable comparison to other projects in terms of risk/reward. This helps when evaluating new potential projects. Your Project Portfolio Management software should offer a variety of presentations to transform the scoring, transforming data into actionable insight.
User Access
Reports and dashboards must be available to stakeholders in several areas of your organization on a secure, robust platform. Such information may be valuable to management as well as to individual contributors.
Distinguish user types (stakeholders and executives, PPM/PMO staff, and Project Managers) and their differing needs for information (on-demand, event-driven notifications, scheduled).
Summary
A Project Portfolio Management Reporting solution provides a secure, robust platform for enterprise reporting for organizations of any size and portfolios of any scale. To learn more about the additional benefits that PPM can deliver please see our “Definitive Guide to Project Portfolio Management”.
To learn more about PPM Reporting, watch this video